

The graph of an inequality in two variables is a region in the rectangular coordinate system. Regions
Question:
The graph of an inequality in two variables is a region in the rectangular coordinate system. Regions in coordinate systems have numerous applications. For example, the regions in the following two graphs indicate whether a person is obese, overweight, borderline overweight, normal weight, or underweight.
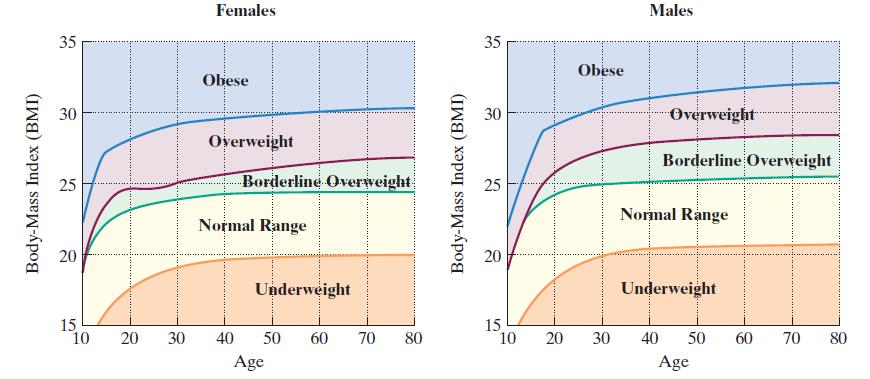 The horizontal axis shows a person’s age. The vertical axis shows that person’s body-mass index (BMI), computed using the following formula:
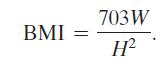
The variable W represents weight, in pounds. The variable H represents height, in inches. Use this information to solve Exercises 85–86.
A woman is 25 years old, 66 inches (5 feet, 6 inches) tall, and weighs 105 pounds.
a. Compute the woman’s BMI. Round to the nearest tenth.
b. Use the woman’s age and her BMI to locate this information as a point in the coordinate system for females. Is this person obese, overweight, borderline overweight, normal weight, or underweight?
Step by Step Answer:
a b A 25 year old w...View the full answer


