

The graph shows that U.S. smokers have a greater probability of suffering from some ailments than the
Question:
The graph shows that U.S. smokers have a greater probability of suffering from some ailments than the general adult population. Exercises 57–58 are based on some of the probabilities, expressed as decimals, shown to the right of the bars. In each exercise, use a calculator to determine the probability, correct to four decimal places.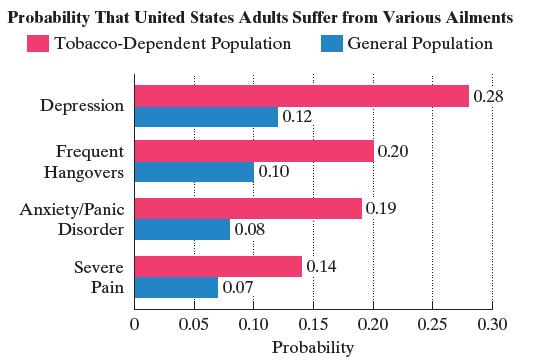
If the probability an event will occur is p and the probability it will not occur is q, then each term in the expansion of (p + q)n represents a probability.
The probability that a smoker suffers from depression is 0.28. If five smokers are randomly selected, the probability that three of them will suffer from depression is the third term of the binomial expansion of
Fantastic news! We've Found the answer you've been seeking!
Step by Step Answer:
0280725 Third T...View the full answer

Answered By
Amit Choudhary
I'm new in this profession regarding online teaching but previously i used to teach students near my college. I am teaching on online platform since last year and got good support from the students. I'm teaching on platforms like chegg and vedantu and also at my home in free time.
1+ Reviews
10+ Question Solved
Related Book For 

Question Posted:
