

The line graph represents the gallons of water W in a small swimming pool after x hours.
Question:
The line graph represents the gallons of water W in a small swimming pool after x hours. 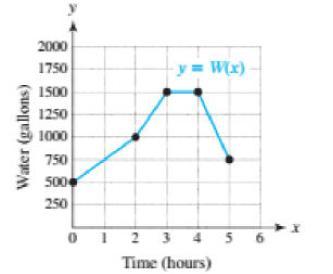
(a) Evaluate W(4) and interpret your result.
(b) Determine the domain D of function W and explain what it represents.
(c) Determine the range R of function W and explain what it represents.
Fantastic news! We've Found the answer you've been seeking!
Step by Step Answer:
a After 4 hours there would be 1500 gallons of water ...View the full answer

Answered By
Leah Muchiri
I am graduate in Bachelor of Actuarial Science and a certified accountant. I am also a prolific writer with six years experience in academic writing. My working principle are being timely and delivering 100% plagiarized free work. I usually present a precised solution to every work am assigned to do. Most of my student earn A++ GRADE using my precised and correct solutions.
52+ Reviews
125+ Question Solved
Related Book For 

College Algebra With Modeling And Visualization
ISBN: 9780134418049
6th Edition
Authors: Gary Rockswold
Question Posted:
