

The table contains real data. Netflix Subscriptions (millions) (a) Determine the maximum and minimum values for each
Question:
The table contains real data.
Netflix Subscriptions (millions)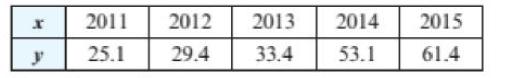
(a) Determine the maximum and minimum values for each variable in the table.
(b) Use your results from part (a) to find an appropriate viewing rectangle.
(c) Make a scatterplot of the data.
(d) Make a line graph of the data.
Fantastic news! We've Found the answer you've been seeking!
Step by Step Answer:
a The maximum number of Netflix subscriptions is 614 mil...View the full answer

Answered By
Mugdha Sisodiya
My self Mugdha Sisodiya from Chhattisgarh India. I have completed my Bachelors degree in 2015 and My Master in Commerce degree in 2016. I am having expertise in Management, Cost and Finance Accounts. Further I have completed my Chartered Accountant and working as a Professional.
Since 2012 I am providing home tutions.
2+ Reviews
10+ Question Solved
Related Book For 

College Algebra With Modeling And Visualization
ISBN: 9780134418049
6th Edition
Authors: Gary Rockswold
Question Posted:
