

The table shows equivalent temperatures in degrees Celsius and degrees Fahrenheit. (a) Plot the data with Fahrenheit
Question:
The table shows equivalent temperatures in degrees Celsius and degrees Fahrenheit.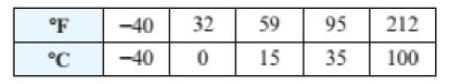
(a) Plot the data with Fahrenheit temperature on the x-axis and Celsius temperature on the y-axis. What type of relation exists between the data?
(b) Find a function C that receives the Fahrenheit temperature x as input and outputs the corresponding Celsius temperature. Interpret the slope.
(c) If the temperature is 83°F, what is it in degrees Celsius?
Fantastic news! We've Found the answer you've been seeking!
Step by Step Answer:
a b c Plot the ordere...View the full answer

Answered By
Joseph Mwaura
I have been teaching college students in various subjects for 9 years now. Besides, I have been tutoring online with several tutoring companies from 2010 to date. The 9 years of experience as a tutor has enabled me to develop multiple tutoring skills and see thousands of students excel in their education and in life after school which gives me much pleasure. I have assisted students in essay writing and in doing academic research and this has helped me be well versed with the various writing styles such as APA, MLA, Chicago/ Turabian, Harvard. I am always ready to handle work at any hour and in any way as students specify. In my tutoring journey, excellence has always been my guiding standard.
1+ Reviews
10+ Question Solved
Related Book For 

College Algebra With Modeling And Visualization
ISBN: 9780134418049
6th Edition
Authors: Gary Rockswold
Question Posted:
