

Find and interpret the average rate of change illustrated in each graph. 16 12 4 2 3
Question:
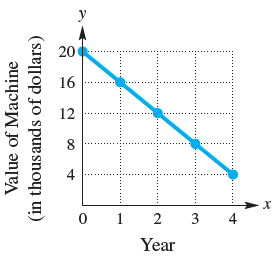
Find and interpret the average rate of change illustrated in each graph.
Fantastic news! We've Found the answer you've been seeking!
Step by Step Answer:
The average rate of change i...View the full answer

Answered By
Payal Mittal
I specialize in finance and accounts.You can ask any question related to til undergradution.Organizational behaviour and HRM are my favourites for you can always relate to them and is an art with practical knowledge base.
226+ Reviews
778+ Question Solved
Related Book For 

College Algebra
ISBN: 978-0134697024
12th edition
Authors: Margaret L. Lial, John Hornsby, David I. Schneider, Callie Daniels
Question Posted:
