

The graph shows numbers of nuclear weapons possessed by the United States and USSR/ Russia from 1950
Question:
The graph shows numbers of nuclear weapons possessed by the United States and USSR/ Russia from 1950 through 2017.
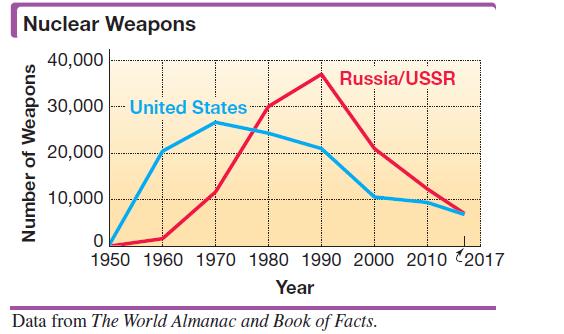
(a) In what year were the numbers of nuclear weapons approximately equal?(b) Approximately how many nuclear weapons did each country possess in that year?(c) Express the point of intersection of the graphs for U.S. and Russian nuclear weapons as an ordered pair of the form (year, number of nuclear weapons).(d) Over the entire period 1950–2017, which country possessed the greatest number of nuclear weapons at any one particular time? In what year did that maximum occur, and what was the approximate number of nuclear weapons possessed?(e) Describe the trend in number of nuclear weapons possessed by Russia from 1990 through 2017. If a straight line were used to approximate its graph, would the line have a slope that is positive, negative, or 0?
Step by Step Answer:
aThe years approximately equal were 1977 and 2017 b ye...View the full answer


Intermediate Algebra
ISBN: 9780134895987
13th Edition
Authors: Margaret Lial, John Hornsby, Terry McGinnis
