

The table shows the percent change in population from 2010 through 2016 for selected metropolitan areas. (a)
Question:
The table shows the percent change in population from 2010 through 2016 for selected metropolitan areas.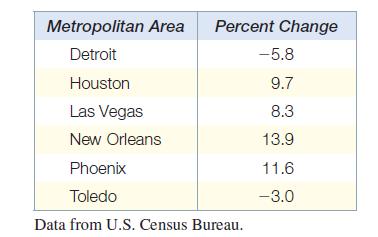
(a) Which metropolitan area had the greatest change in population? What was this change? Was it an increase or a decrease?(b) Which metropolitan area had the least change in population? What was this change? Was it an increase or a decrease?
Fantastic news! We've Found the answer you've been seeking!
Step by Step Answer:
a To determine the metropolitan area with the greatest ...View the full answer

Answered By
Surendar Kumaradevan
I have worked with both teachers and students to offer specialized help with everything from grammar and vocabulary to challenging problem-solving in a range of academic disciplines. For each student's specific needs, I can offer explanations, examples, and practice tasks that will help them better understand complex ideas and develop their skills.
I employ a range of techniques and resources in my engaged, interesting tutoring sessions to keep students motivated and on task. I have the tools necessary to offer students the support and direction they require in order to achieve, whether they need assistance with their homework, test preparation, or simply want to hone their skills in a particular subject area.
0 Reviews
10+ Question Solved
Related Book For 

Intermediate Algebra
ISBN: 9780134895987
13th Edition
Authors: Margaret Lial, John Hornsby, Terry McGinnis
Question Posted:
