

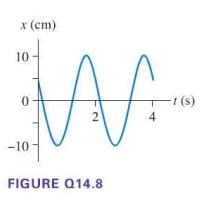
For the graph in Figure Q14.8, determine the frequency f and the oscillation amplitude A. x (cm)
Question:
For the graph in Figure Q14.8, determine the frequency f and the oscillation amplitude A.
Fantastic news! We've Found the answer you've been seeking!
Step by Step Answer:
To determine the frequency f we need to find the number of cycles completed in a gi...View the full answer

Answered By
BRIAN MUSINGA
I possess a Bachelors of Commerce degree(Marketing option) and am currently undertaking an MBA in marketing. I believe that I possess the required knowledge and skills to tutor in the subject named. I have also written numerous research academic papers much to the satisfaction of clients and my professors.
2+ Reviews
17+ Question Solved
Related Book For 
College Physics A Strategic Approach
ISBN: 9780321595492
2nd Edition
Authors: Randall D. Knight, Brian Jones, Stuart Field
Question Posted:
