

The position graph of Figure P2.6 represents the motion of a ball being rolled back and forth
Question:
The position graph of Figure P2.6 represents the motion of a ball being rolled back and forth by two children.
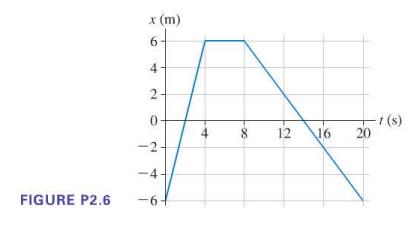
a. At what positions are the two children sitting?
b. Draw the ball's velocity-versus-time graph. Include a numerical scale on both axes.
Step by Step Answer:

This question has not been answered yet.
You can Ask your question!
Related Book For 
College Physics A Strategic Approach
ISBN: 9780321595492
2nd Edition
Authors: Randall D. Knight, Brian Jones, Stuart Field
Question Posted:
