

Velocity-versus-time graphs for three drag racers are shown in Figure Q2.20. At t =5.0 s, which car
Question:
Velocity-versus-time graphs for three drag racers are shown in Figure Q2.20. At t =5.0 s, which car has traveled the furthest?
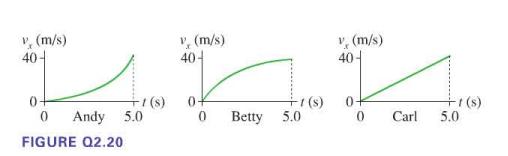
A. Andy
B. Betty
C. Carl
D. All have traveled the same distance.
Fantastic news! We've Found the answer you've been seeking!
Step by Step Answer:
To determine which car has traveled the furthest at t 50 seconds we can use the area under t...View the full answer

Answered By
PALASH JHANWAR
I am a Chartered Accountant with AIR 45 in CA - IPCC. I am a Merit Holder ( B.Com ). The following is my educational details.
PLEASE ACCESS MY RESUME FROM THE FOLLOWING LINK: https://drive.google.com/file/d/1hYR1uch-ff6MRC_cDB07K6VqY9kQ3SFL/view?usp=sharing
3+ Reviews
10+ Question Solved
Related Book For 
College Physics A Strategic Approach
ISBN: 9780321595492
2nd Edition
Authors: Randall D. Knight, Brian Jones, Stuart Field
Question Posted:
