

Figure P2.20 shows a graph of actual position-versus-time data for a particular type of drag racer known
Question:
Figure P2.20 shows a graph of actual position-versus-time data for a particular type of drag racer known as a "funny car."
Figure P2.20
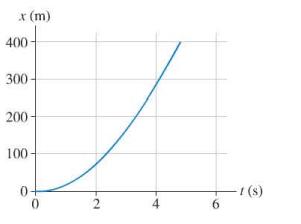
a. Estimate the car's velocity at 2.0 s.
b. Estimate the car's velocity at 4.0 s.
Fantastic news! We've Found the answer you've been seeking!
Step by Step Answer:
a Estimate the cars velocity at 20 s To estimate the cars velocit...View the full answer

Answered By
Nicole omwa
Being a highly skilled tutor with at least 5 years of tutoring experience in different areas, I learned how to help diverse learners in writing drafts of research papers, actual research papers and locate credible sources. My assurance is built upon my varied knowledge of a variety of subjects. Furthermore, my involvement and interaction with numerous learners of all levels has allowed me to understand my clients' specific demands. Ultimately, this has aided me in being a better coach to learners to better their grades. Essentially, my responsibilities as a tutor would include:
Teaching abilities that assist pupils in enhancing their academic performance
Personal interaction with learners to make them understand abstract concepts
Inducing new skills and knowledge into their academic journeys
Fostering individual reflection, and independent and critical thinking
Editing and proofreading
Because I am constantly available to respond to your queries, you may decide to rely on me whenever you require my assistance. As an assurance, my knowledge skills and expertise enable me to quickly assist learners with different academic challenges in areas with difficulty in understanding. Ultimately, I believe that I am a reliable tutor concerned about my learner's needs and interests to solve their urgent projects. My purpose is always to assist them in comprehending abstract schoolwork and mastering their subjects. I also understand that plagiarism is a severe offense and has serious ramifications. Owing to this, I always make it a point to educate learners on the numerous strategies to have uniquely unique solutions. I am familiar with the following formatting styles:
MLA
APA
Harvard
Chicago
IEEE
Communication is always the key in every interaction with my learners. Hence, I provide timely communication about the progress of assigned projects. As a result, I make sure that I maintain excellent communication with all of my clients. I can engage with all of my customers more effectively, assisting them with their unique academic demands. Furthermore, I attempt to establish a solid working relationship with my leaners I have exceptional abilities in the below areas;
Sociology
History
Nursing
Psychology
Literature
Health and Medicine
Chemistry
Biology
Management
Marketing
Business
Earth Science
Environmental Studies
Education
Being a teacher who aces in diverse fields, I provide various academic tasks, which include;
Academic Reports
Movie Reviews
Literature Reviews
Annotated bibliographies
Lab reports
Discussion posts
Dissertations
Case study analyses
Research proposals
Argumentative Essays
I guarantee you high-quality Papers!!!!!
17+ Reviews
32+ Question Solved
Related Book For 

College Physics A Strategic Approach
ISBN: 9780321595492
2nd Edition
Authors: Randall D. Knight, Brian Jones, Stuart Field
Question Posted:
