

The diagram shows the graph of y = f(x). On separate diagrams, sketch the graphs of a)
Question:
The diagram shows the graph of y = f(x).
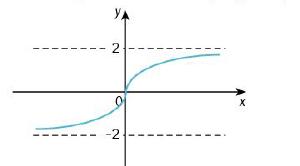
On separate diagrams, sketch the graphs of
a) y = f(−x)
b) y = f(x − 1)
c) y = −f(2x)
d) y = 3f(4x).
On each sketch, write the equation of any
asymptotes and, where possible, write the
coordinates where the graph cuts the axes.
Fantastic news! We've Found the answer you've been seeking!
Step by Step Answer:
Part a Part b Part ...View the full answer

Answered By
PALASH JHANWAR
I am a Chartered Accountant with AIR 45 in CA - IPCC. I am a Merit Holder ( B.Com ). The following is my educational details.
PLEASE ACCESS MY RESUME FROM THE FOLLOWING LINK: https://drive.google.com/file/d/1hYR1uch-ff6MRC_cDB07K6VqY9kQ3SFL/view?usp=sharing
3+ Reviews
10+ Question Solved
Related Book For 

Complete Pure Mathematics 1 For Cambridge International AS & A Level
ISBN: 9780198427438
2nd Edition
Authors: Jean Linsky, Brian Western, James Nicholson
Question Posted:
