

The diagram shows the graph of f(x). On separate diagrams, sketch the graphs of a) y =
Question:
The diagram shows the graph of f(x).
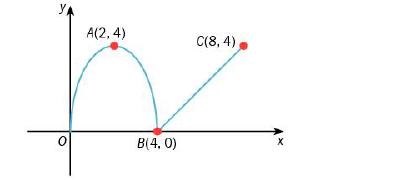
On separate diagrams, sketch the graphs of
a) y = f(4x)
b) y = f(3x)
c) y = − f(x + 1)
d) y = 2f(− x).
On each sketch, mark the new position of
the points O, A, B and C, writing down their
coordinates.
Fantastic news! We've Found the answer you've been seeking!
Step by Step Answer:

Answered By
Muhammad Mahtab
everyone looks that their work be perfect. I have more than a five year experience as a lecture in reputable institution, national and international. I provide perfect solution in marketing, case study, finance problems, blog writing, article writing, business plans, strategic management, human resource, operation management, power point presentation and lot of clients need. Here is right mentor who help clients in their multi-disciplinary needs.
3+ Reviews
14+ Question Solved
Related Book For 

Complete Pure Mathematics 1 For Cambridge International AS & A Level
ISBN: 9780198427438
2nd Edition
Authors: Jean Linsky, Brian Western, James Nicholson
Question Posted:
