

Draw the graph of the NRZ-L scheme using each of the following data streams, assuming that the
Question:
a. 00000000
b. 11111111
c. 01010101
d. 00110011
Fantastic news! We've Found the answer you've been seeking!
Step by Step Answer:
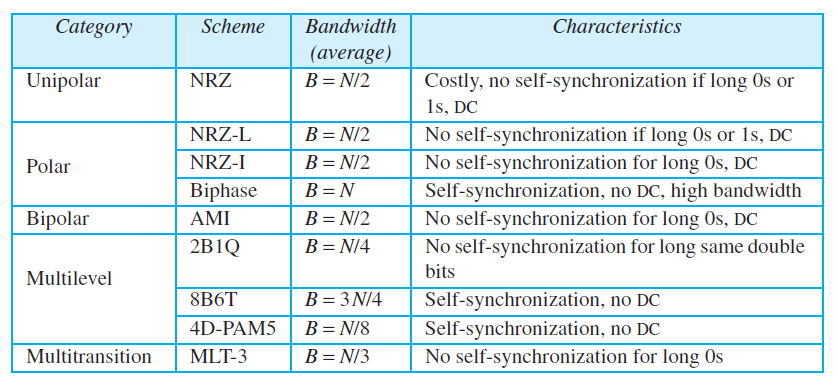
See the following figure Bandwidth is proportional to 38N w...View the full answer

Answered By
Larlyu mosoti
I am a professional writer willing to do several tasks free from plagiarism, grammatical errors and submit them in time. I love to do academic writing and client satisfaction is my priority. I am skilled in writing formats APA, MLA, Chicago, and Harvard I am a statistics scientist and I can help out in analyzing your data. I am okay with SPSS, EVIEWS, MS excel, and STATA data analyzing tools.
Statistical techniques: I can do linear regression, time series analysis, logistic regression, and some basic statistical calculations like probability distributions. . I'm ready for your working projects!
Services I would offer:
• Academic writing.
• Article writing.
• Data entry.
• PDF conversion.
• Word conversion
• Proofreading.
• Rewriting.
• Data analyzing.
The best reason to hire me:
- Professional and Unique work in writing.
- 100% satisfaction Guaranteed
- within required time Express delivery
- My work is plagiarism Free
- Great communication
My passion is to write vibrantly with dedication. I am loyal and confident to give my support to every client. Because Client satisfaction is much more important to me than the payment amount. A healthy client-contractor relationship benefits in the longer term. Simply inbox me if you want clean work.
3+ Reviews
10+ Question Solved
Related Book For 
Question Posted:
