

Congressional elections are decided by a clear rule: whoever gets the most votes in November wins. Because
Question:
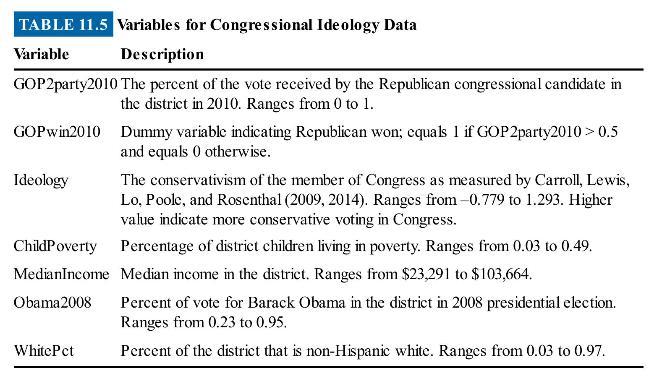
Congressional elections are decided by a clear rule: whoever gets the most votes in November wins. Because virtually every congressional race in the United States is between two parties, whoever gets more than 50 percent of the vote wins. \({ }^{2}\) We can use this fact to estimate the effect of political party on ideology. Some argue that Republicans and Democrats are very distinctive; others argue that members of Congress have strong incentives to respond to the median voter in their districts, regardless of party. We can assess how much party matters by looking at the ideology of members of Congress in the 112th Congress (which covered the years 2011 and 2012). Table 11.5 lists the variables.
(a) Suppose we try to explain congressional ideology as a function of political party only. Explain how endogeneity might be a problem.
(b) How can an RD model fight endogeneity when we are trying to assess if and how party affects congressional ideology?
(c) Generate a scatterplot of congressional ideology against GOP2party2010, and based on this plot, discuss what you think the \(\mathrm{RD}\) analysis will indicate.
(d) Write down a basic RD model for this question, and explain the terms.
(e) Estimate a basic RD model, and interpret the coefficients.
(f) Create an adjusted assignment variable (equal to GOP2party 2010 -0.50 ), and use it to estimate a varying slopes RD model. Interpret the coefficients. Create a graphic that has a scatterplot of the data and fitted lines from the model, and calculate the fitted values for four observations: a Democrat with GOP2party \(2010=0\), a Democrat with GOP2party2010 \(=0.5\), a Republican with GOP2party2010 \(=0.5\), and a Republican with GOP2party 2010 \(=1.0\).
(g) Reestimate the varying slopes model, but use the unadjusted variable (and unadjusted interaction). Compare the coefficient estimates to your results in part (f). Calculate the fitted values for four observations: a Democrat with GOP2party \(2010=0\), a Democrat with GOP2party2010 \(=0.5\), a Republican with GOP2party2010 \(=0.5\), and a Republican with GOP2party \(2010=\) 1.0). Compare to the fitted values in part (f).
(h) Assess whether there is clustering of the dependent variable just above the cutoff.
(i) Assess whether there are discontinuities at GOP2party2010 \(=0.50\) for ChildPoverty, MedianIncome, Obama2008, and WhitePct. Discuss the implications of your findings.
(j) Estimate a varying slopes model controlling for ChildPoverty, MedianIncome, Obama2008, and WhitePct. Discuss these results in light of your findings from the part (i).
(k) Estimate a quadratic RD model, and interpret the results.
(I) Estimate a varying slopes model with a window of GOP vote share from 0.4 to 0.6 . Discuss any meaningful differences in coefficients and standard errors from the earlier varying slopes model.
(m) Which estimate is the most credible?
Step by Step Answer:

This question has not been answered yet.
You can Ask your question!

Real Econometrics The Right Tools To Answer Important Questions
ISBN: 9780190857462
2nd Edition
Authors: Michael Bailey
