

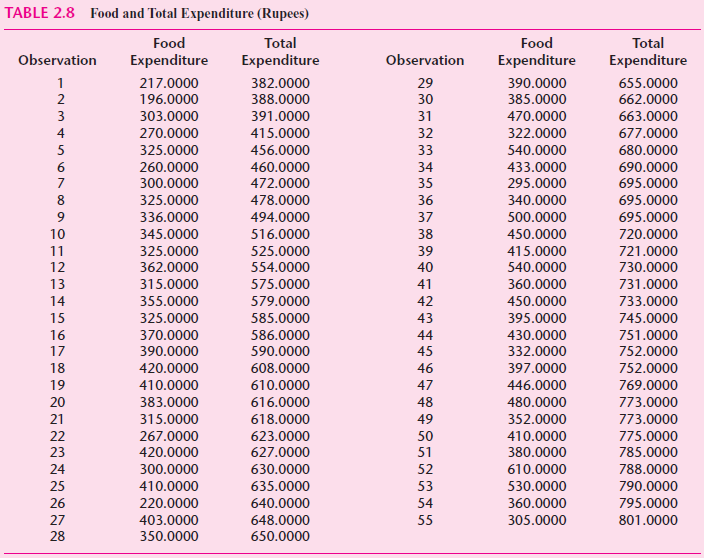
Table 2.8 gives data on expenditure on food and total expenditure, measured in rupees, for a sample
Question:
a. Plot the data, using the vertical axis for expenditure on food and the horizontal axis for total expenditure, and sketch a regression line through the scatter points.
b. What broad conclusions can you draw from this example?
c. A priori, would you expect expenditure on food to increase linearly as total expenditure increases regardless of the level of total expenditure? Why or why not? You can use total expenditure as a proxy for total income.
Fantastic news! We've Found the answer you've been seeking!
Step by Step Answer:
a The scattergram and the regression line look as follows b As tota...View the full answer

Answered By
DEEPIKA SINGH
i m teacher of physics from last two years
0 Reviews
10+ Question Solved
Related Book For 

Question Posted:
