

Draw a graph to illustrate the U.S. wholesale market for roses. Show the equilibrium in that market
Question:
Draw a graph to illustrate the U.S. wholesale market for roses. Show the equilibrium in that market with no international trade and the equilibrium with free trade. Mark the quantity of roses produced in the United States, the quantity imported, and the total quantity bought.
Wholesalers buy and sell roses in containers that hold 120 stems. The table provides information about the wholesale market for roses in the United States. The demand schedule is the wholesalers’ demand and the supply schedule is the U.S. rose growers’ supply.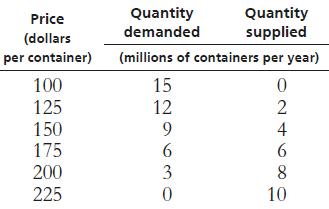
Step by Step Answer:

This question has not been answered yet.
You can Ask your question!
Related Book For 

Question Posted:
