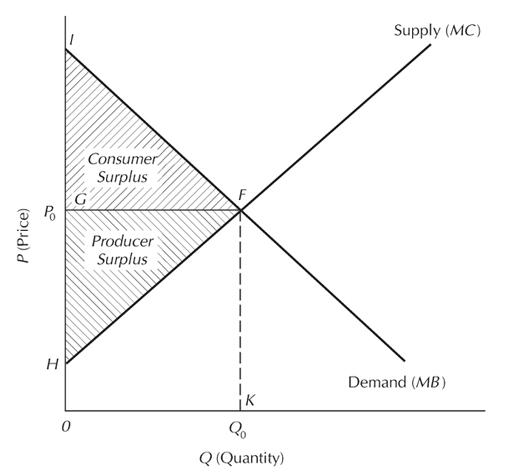
In Figure 251, what area represents the total cost of producing Q0 units of output? Figure 25-1:
Question:
In Figure 25–1, what area represents the total cost of producing Q0 units of output?
Figure 25-1:

Transcribed Image Text:
P (Price) H 0 Consumer Surplus Producer: Surplus 77 Q (Quantity) Supply (MC) Demand (MB)
Fantastic news! We've Found the answer you've been seeking!
Step by Step Answer:
Answer rating: 100% (QA)
The are...View the full answer

Answered By

JAPHETH KOGEI
Hi there. I'm here to assist you to score the highest marks on your assignments and homework. My areas of specialisation are:
Auditing, Financial Accounting, Macroeconomics, Monetary-economics, Business-administration, Advanced-accounting, Corporate Finance, Professional-accounting-ethics, Corporate governance, Financial-risk-analysis, Financial-budgeting, Corporate-social-responsibility, Statistics, Business management, logic, Critical thinking,
So, I look forward to helping you solve your academic problem.
I enjoy teaching and tutoring university and high school students. During my free time, I also read books on motivation, leadership, comedy, emotional intelligence, critical thinking, nature, human nature, innovation, persuasion, performance, negotiations, goals, power, time management, wealth, debates, sales, and finance. Additionally, I am a panellist on an FM radio program on Sunday mornings where we discuss current affairs.
I travel three times a year either to the USA, Europe and around Africa.
As a university student in the USA, I enjoyed interacting with people from different cultures and ethnic groups. Together with friends, we travelled widely in the USA and in Europe (UK, France, Denmark, Germany, Turkey, etc).
So, I look forward to tutoring you. I believe that it will be exciting to meet them.
3.00+
2+ Reviews
10+ Question Solved
Related Book For 

Question Posted:
Students also viewed these Business questions
-
3 1:09:02 bok Assets Cash Accounts receivable, net Inventory Total current assets Equipment Accum. depreciation-Equipment Total assets Liabilities and Equity Accounts payable Salaries payable Total...
-
Suppose that initially the data in Problem 24-17 apply, but then an increase in fixed costs occurs. As a result, the ATC curve in Figure 24-6 shifts upward. Consequently, the average total cost of...
-
Suppose you are a money manager of a $5 million investment fund. The fund is invested in four funds with the following investments and betas: Stock A B Shares 100,000 100,000 75,000 20,000 C D Price...
-
Explain how the inability of public employees to strike affects the bargaining process.
-
Find the difference quotient of g. g(x) = 3
-
Is the initiator of a use case the same as the primary actor? Explain.
-
Use the same information as in E10-8, except that the warehouse owned by Denver Company has a fair value of $33,000, and therefore the Bristol Company agrees to pay the Denver Company $3,000 to...
-
If you have $577 today and you think you can earn an interest rate of 6% per year, how many years until you have $982?
-
What is Area IFH in Figure 251? Figure 25-1: P (Price) H 0 Consumer Surplus Producer: Surplus 77 Q (Quantity) Supply (MC) Demand (MB)
-
In Figure 251, what area represents the total value of Q0 units of output? Figure 25-1: P (Price) H 0 Consumer Surplus Producer: Surplus 77 Q (Quantity) Supply (MC) Demand (MB)
-
How does having low self-efficacy interfere with task performance?
-
What are the cost elements in EOQ? Question 5Answer a. Heating costs, obsolescence, and theft b. Shrinkage, gross stock errors, and net stock errors. c. Holding costs and shipping costs d. Shipping...
-
Attempt a fundamental evaluation of Torrington on a standalone basis
-
The judge knows relatively little about each case. Group of answer choices True False
-
For this video, please answer the following questions. Your perspective should be that of a voter within the state of Texas. How does each candidate present himself in this debate? For example, you...
-
If the firm it paid $1.73 per share in dividends, its dividend payout ratio would be ______ enter your response here%. (Round to two decimal places.)
-
Refer to Practice 9-8. Compute the following: 1. LIFO reserve at the end of Year 4. 2. Cost of goods sold for Year 4. 3. Cost of goods sold for Year 4 assuming that units purchased had been 75...
-
1. Following are information about Alhadaf Co. Cost incurred Inventory Purchases Sales Adverting expense Salary Expense Depreciation Beginning Inventory Ending Inventory Amount 118,000 350.000 90,000...
-
If the government budget remains balanced, what are the real interest rate, investment, and private saving? Does any crowding out occur? Use the loanable funds data in Problem 8 and the following...
-
If the Ricardo-Barro effect occurs, what are the real interest rate and investment? Use the data in Problem 8 along with news that the government now has a budget deficit of $1 trillion to work...
-
What is the real interest rate? How much investment occurs? Does crowding out occur? Use the data in Problem 8 along with news that the government now has a budget deficit of $1 trillion to work...
-
SecuriCorp operates a fleet of armored cars that make scheduled pickups and deliveries in the Los Angeles area. The company is implementing an activity-based costing system that has four activity...
-
Redwood Company sells craft kits and supplies to retail outlets and through its catalog. Some of the items are manufactured by Redwood, while others are purchased for resale. For the products it...
-
The cost structure of Dennis's Retail Mart is dominated by variable costs with a contribution margin ratio of 0.31 and fixed costs of $111,420. Every dollar of sales contributes 31 cents toward fixed...

Study smarter with the SolutionInn App


