

The data below follows a trend of the form y = ax n , where a and
Question:
The data below follows a trend of the form y = axn, where a and n are constants.
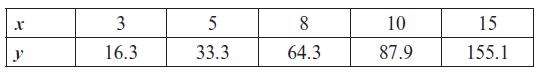
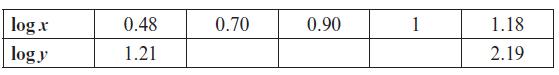
a. Copy and complete the table of values of log x and log y, giving your answers to 2 decimal places.
b. Plot a graph of log y against log x and draw in a line of best fit.
c. Use your graph to estimate the values of a and n to one decimal place.
Fantastic news! We've Found the answer you've been seeking!
Step by Step Answer:
a log x 048 070 090 1 118 log y 121 152 181 194 219 b The plot of log y against log x ...View the full answer

Answered By
Carly Cimino
As a tutor, my focus is to help communicate and break down difficult concepts in a way that allows students greater accessibility and comprehension to their course material. I love helping others develop a sense of personal confidence and curiosity, and I'm looking forward to the chance to interact and work with you professionally and better your academic grades.
12+ Reviews
21+ Question Solved
Related Book For 

Edexcel AS And A Level Mathematics Pure Mathematics Year 1/AS
ISBN: 9781292183398
1st Edition
Authors: Greg Attwood
Question Posted:
