

The diagram shows a sketch of the curve y = f(x). The point B(0, 0) lies on
Question:
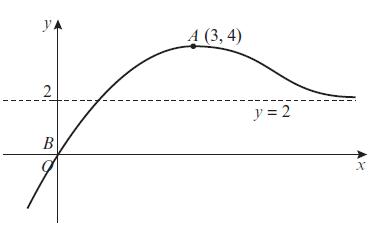
The diagram shows a sketch of the curve y = f(x). The point B(0, 0) lies on the curve and the point A(3, 4) is a maximum point. The line y = 2 is an asymptote. Sketch the following and in each case give the coordinates of the new positions of A and B and state the equation of the asymptote:
a. f(2x)
b. 1/2 f(x)
c. f(x) − 2
d. f(x + 3)
e. f(x − 3)
f. f(x) + 1
Fantastic news! We've Found the answer you've been seeking!
Step by Step Answer:
For each transformation of the function fx I will describe how the coordinates of A3 4 and B0 0 are ...View the full answer

Answered By
SUMAN DINDA
I LIKE TO TEACH STUDENTS. SO, I START MYSELF AS A PRIVATE TUTOR. I TEACH STUDENTS OF DIFFERENT CLASSES. I HAVE ALSO DONE BACHELOR OF EDUCATION DEGREE(B.ED). DURING THIS COURSE I HAD TO TEACH IN A SCHOOL. SO I HAVE A GOOD EXPERIENCE IN TEACHING.
1+ Reviews
10+ Question Solved
Related Book For 
Edexcel AS And A Level Mathematics Pure Mathematics Year 1/AS
ISBN: 9781292183398
1st Edition
Authors: Greg Attwood
Question Posted:
