

The figure shows a sketch of the curve with equation y = f(x). The curve passes through
Question:
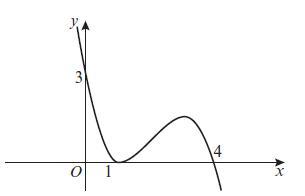
The figure shows a sketch of the curve with equation y = f(x). The curve passes through the points (0, 3) and (4, 0) and touches the x-axis at the point (1, 0). On separate diagrams, sketch the curves with equations
a. y = f(x + 1)
b. y = 2f(x)
c. y = f(1/2x)
On each diagram, show clearly the coordinates of all the points where the curve meets the axes.
Step by Step Answer:

This question has not been answered yet.
You can Ask your question!
Related Book For 

Edexcel AS And A Level Mathematics Pure Mathematics Year 1/AS
ISBN: 9781292183398
1st Edition
Authors: Greg Attwood
Question Posted:
