

Assume you are a realtor in Bradenton, Florida. You have recently obtained a listing of the selling
Question:
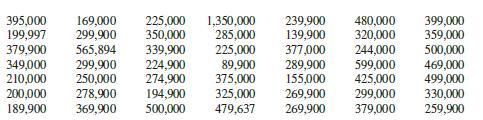
Assume you are a realtor in Bradenton, Florida. You have recently obtained a listing of the selling prices of the homes that have sold in that area in the last 6 months. You wish to organize those data so you will be able to provide potential buyers with useful information. Use the following data to create a histogram, frequency polygon, and cumulative frequency polygon.
1. What questions could be answered more easily by looking at the histogram rather than the listing of home prices?
2. What different questions could be answered more easily by looking at the frequency polygon rather than the listing of home prices?
3. What different questions could be answered more easily by looking at the cumulative frequency polygon rather than the listing of home prices?
4. Are there any extremely large or extremely small data values compared to the other data values?
5. Which graph displays these extremes the best?
6. Is the distribution skewed?
Step by Step Answer:

This question has not been answered yet.
You can Ask your question!

Elementary Statistics A Step By Step Approach
ISBN: 9781260360653
11th Edition
Authors: Allan Bluman
