

The graph shows the number of deaths in the United States due to accidents. Answer the following
Question:
The graph shows the number of deaths in the United States due to accidents. Answer the following questions about the graph.
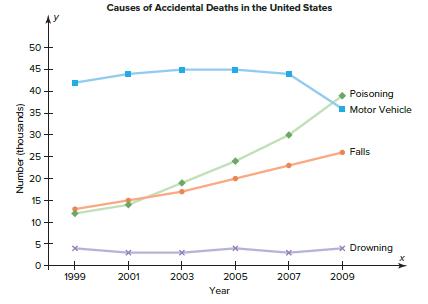
1. Name the variables used in the graph.
2. Are the variables qualitative or quantitative?
3. What type of graph is used here?
4. Which variable shows a decrease in the number of deaths over the years?
5. Which variable or variables show an increase in the number of deaths over the years?
6. The number of deaths in which variable remains about the same over the years?
7. List the approximate number of deaths for each category for the year 2001.
8. In 1999, which variable accounted for the most deaths? In 2009, which variable accounted for the most deaths?
9. In what year were the numbers of deaths from poisoning and falls about the same?
Step by Step Answer:

This question has not been answered yet.
You can Ask your question!


Elementary Statistics A Step By Step Approach
ISBN: 9781260360653
11th Edition
Authors: Allan Bluman
