

Construct a histogram, frequency polygon, and ogive for the data in Exercise 22. Analyze the histogram. Data
Question:
Construct a histogram, frequency polygon, and ogive for the data in Exercise 22. Analyze the histogram.
Data from in Exercise 22
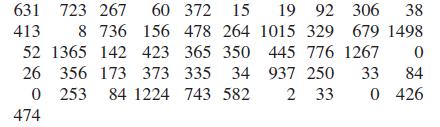
The following data represent the energy consumption of coal (in billions of Btu) by each of the 50 states and the District of Columbia. Use the data to construct a frequency distribution and a relative frequency distribution with 7 classes.
Fantastic news! We've Found the answer you've been seeking!
Step by Step Answer:
To construct a histogram frequency polygon and ogive for the given data we first need ...View the full answer

Answered By
Churchil Mino
I have been a tutor for 2 years and have experience working with students of all ages and abilities. I am comfortable working with students one-on-one or in small groups, and am able to adapt my teaching style to meet the needs of each individual. I am patient and supportive, and my goal is to help my students succeed.
I have a strong background in math and science, and have tutored students in these subjects at all levels, from elementary school to college. I have also helped students prepare for standardized tests such as the SAT and ACT. In addition to academic tutoring, I have also worked as a swim coach and a camp counselor, and have experience working with children with special needs.
0 Reviews
10+ Question Solved
Related Book For 
Elementary Statistics A Step By Step Approach
ISBN: 9780077665807
9th Edition
Authors: Allan G. Bluman
Question Posted:
