The amount spent (in billions of dollars) for ads online is shown. (The numbers for 2011 through
Question:
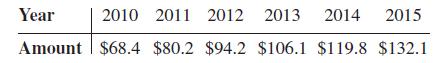
The amount spent (in billions of dollars) for ads online is shown. (The numbers for 2011 through 2015 are projected numbers.) Draw a time series graph and comment on the trend.
Transcribed Image Text:
Year 2010 2011 2012 2013 2014 2015 Amount $68.4 $80.2 $94.2 $106.1 $119.8 $132.1
Fantastic news! We've Found the answer you've been seeking!
Step by Step Answer:
Answer rating: 58% (12 reviews)
Construct the time series plot for the amount spent for ...View the full answer
Answered By
Umar Jalal
Hi
This is Umar.
I can help you in the following fields:
1. Accounting
2. Statistics
3. Chemistry
4. Physics
5. Computer Science (Programming)
6. MATH
Linear Algebra
Calculus and Analytical Geometry
Trigonometry
Mathematical Physics
Complex analysis
Vector spaces
Bayes Theorem
Distributions
T distribution
Difference in means
Sampling distribution
Chi-square
Hypothesis Testing
T Paired tests
Confidence intervals
Regression Analysis
All kinds of probability
My services will be in the form of:
· Handwritten file
· Word file
· Step-by-step complete solution
· 100% accurate answer
0.00
0 Reviews
10+ Question Solved
Related Book For
Elementary Statistics A Step By Step Approach
ISBN: 9780077665807
9th Edition
Authors: Allan G. Bluman
Question Posted:
Students also viewed these Statistics questions
-
The average global temperatures for the following years are shown. Draw a time series graph and comment on the trend. Year Temperature 57.98 58.11 57.99 58.01 57.88 2004 2005 2006 2007 2008
-
The following data show the amount of gold production in thousands of troy ounces for Colombia for recent years. Draw a time series graph and comment on the trend. Year 03 04'05 06 07 08 Amount 656...
-
The data show the average amount of money spent by consumers on Valentines Day. Draw a time series graph for the data and comment on the trend. Year 2007 2008 2009 2010 2011 2012 2012 $120 $123 $103...
-
Apply normalization (1NF, 2NF and 3NF) of the system description given below and justify why relation needs 1NF, 2NF, and 3NF or not. At the end shift normalized data into Un-Normalized Data. S ystem...
-
A company that manufactures paving material for driveways and parking lots expects the following demand for its product for tire next four months. The companys machine standard time and available...
-
A compressor delivers natural gas through a straight pipe of length \(L\). Find the pressure at the exit. Include frictional losses in the pipe. The energy balance should now include the frictional...
-
The distribution of the ages of the winners of the Tour de France from 1903 to 2016 is approximately bell-shaped. The mean age is 27.9 years, with a standard deviation of 3.3 years. Use the...
-
Morris Supply Company had the following transactions in 2010. 1. Acquired $50,000 cash from the issue of common stock. 2. Purchased $210,000 of merchandise for cash in 2010. 3. Sold merchandise that...
-
Lets say a portion of money that you add, usually, in a package at Quellenhof to cover the fee. Example: a hotel room costs 200 and the flight 100. Total 300. However, the guest did not book it...
-
Instead of all residents having identical marginal benefit schedules, themarginal benefit per gardener varies for five residents according to the following table: Marginal Benefit for Each Gardener...
-
Using the data from Data Set XI in Appendix B, construct a frequency distribution and draw a frequency polygon. Describe briefly the shape of the distribution for the number of pages in statistics...
-
For Exercises find the class boundaries, midpoints, and widths for each class. 4347
-
Selected financial data for Black & Decker and Snap-On Tools for 2007 are presented here (in millions). Instructions (a) For each company, compute the following ratios. (1) Current ratio. (2)...
-
What assumptions concerning the slope coefficient b must we make when we use dummy variables in a regression?
-
Mention some situations in which two-stage cluster sampling should be used.
-
Compare the ways the regression coefficients are interpreted in simple regression and in multiple regression.
-
Explain how a price-weighted stock index must be adjusted to reflect the stock split of a company.
-
How are simple and multiple regression similar? How are they different?
-
Classify each of these as a scalar or vector. (a) 3B; (b) C: B; (c) C B; (d) B; (e) Velocity; (f) Potential energy.
-
Hardin Services Co. experienced the following events in 2016: 1. Provided services on account. 2. Collected cash for accounts receivable. 3. Attempted to collect an account and, when unsuccessful,...
-
Six students are performing one song each in a jazz vocal recital. Two students have repertoires of five numbers, and the others have four songs each prepared. How many different programs are...
-
Wake Up cereal comes in 2 types, crispy and crunchy. If a researcher has 10 boxes of each, how many ways can she select 3 boxes of each for a quality control test?
-
How many ways can you pick 4 students from 10 students (6 men, 4 women) if you must have an equal number of each gender or all of the same gender?
-
Assume you have a portfolio consisting of a $400,000 investment in stock A and a $600,000 investment in stock B. Suppose that the daily volatilities of these two assets are 2% and 1.5%, respectively,...
-
What is the role of education in promoting social mobility and reducing inequality, and how can educational systems be reformed to better serve diverse populations while preparing individuals for the...
-
A European call option and put option on a non-dividend paying stock both have a strike price of $51 and an expiration date in 6 months. The put sells for $2.50 and the call sells for $2. The...
Study smarter with the SolutionInn App