Using the data from Data Set XI in Appendix B, construct a frequency distribution and draw a
Question:
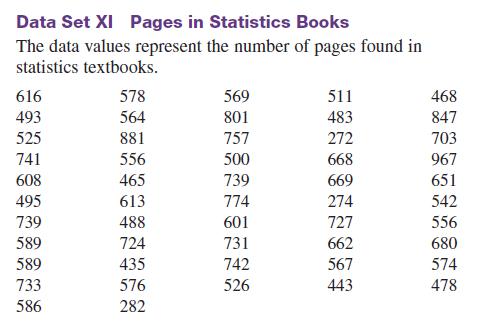
Using the data from Data Set XI in Appendix B, construct a frequency distribution and draw a frequency polygon. Describe briefly the shape of the distribution for the number of pages in statistics books.
Data from Set XI Appendix B
Transcribed Image Text:
Data Set XI Pages in Statistics Books The data values represent the number of pages found in statistics textbooks. 616 493 525 741 608 495 739 589 589 733 586 578 564 881 556 465 613 488 724 435 576 282 569 801 757 500 739 774 601 731 742 526 511 483 272 668 669 274 727 662 567 443 468 847 703 967 651 542 556 680 574 478
Fantastic news! We've Found the answer you've been seeking!
Step by Step Answer:
Answer rating: 81% (11 reviews)
ANSWER To construct a frequency distribution for the number of pages in statistics books we need ...View the full answer
Answered By
Akash M Rathod
I have been utilized by educators and students alike to provide individualized assistance with everything from grammar and vocabulary to complex problem-solving in various academic subjects. I can provide explanations, examples, and practice exercises tailored to each student's individual needs, helping them to grasp difficult concepts and improve their skills.
My tutoring sessions are interactive and engaging, utilizing a variety of tools and resources to keep learners motivated and focused. Whether a student needs help with homework, test preparation, or simply wants to improve their skills in a particular subject area, I am equipped to provide the support and guidance they need to succeed.
0.00
0 Reviews
10+ Question Solved
Related Book For
Elementary Statistics A Step By Step Approach
ISBN: 9780077665807
9th Edition
Authors: Allan G. Bluman
Question Posted:
Students also viewed these Statistics questions
-
Using the data from Data Set IV in Appendix B, construct a frequency distribution and draw a histogram. Describe briefly the shape of the distribution of the tallest buildings in New York City. Data...
-
Construct a frequency distribution and has the greatest relative frequency and which has the least relative frequency? relative frequency histogram for the data set using five classes. Which class...
-
Q1. Industrial engineers periodically conduct "work measurement" analyses to determine the time used to produce a single unit of output. At a large processing plant, the total number of man-hours...
-
What are the Marketing Cost Estimates of Pepsi Company? Marketing estimates, in 2013-2019? It can be write in a paragraph and explain it statistically.
-
A company produces two very' similar products, A and B, that go through a three-step sequence of fabrication, assembly, and packaging. Each step requires one day for a lot to be completely processed...
-
Water flows from an elevated reservoir through a conduit to a turbine at a lower level through a conduit of the same diameter. The elevation difference is \(90 \mathrm{~m}\). The inlet pressure is...
-
The distribution of the ages of the winners of the Tour de France from 1903 to 2016 is approximately bell-shaped. The mean age is 27.9 years, with a standard deviation of 3.3 years. Use the...
-
Seventy-two percent of the members of the United Food and Commercial Workers Local 655 voted to strike against Stop n Shop in the St. Louis area. In fear of similar union responses, two of Stop n...
-
Analyze the case analysis titled "The Cage" and answer the following questions. Explain it clearly and elaborate. 1. What should Sanjay's next steps be in preparing the GMs to take on added...
-
Chris and Stefani Watanabe live with their two boys at 1400 Victoria Lane, Riverside, CA 92501. Chris is an accountant who has his own accounting practice. Stefani is an elementary school teacher....
-
The type of graph used to represent data is determined by the type of data collected and by the researchers purpose.
-
The amount spent (in billions of dollars) for ads online is shown. (The numbers for 2011 through 2015 are projected numbers.) Draw a time series graph and comment on the trend. Year 2010 2011 2012...
-
Consider the discrete-time system shown in figure (a) Compute the 10 first samples of its impulse response. (b) Find the input-output relation. (c) Apply the input x(n) = {1, 1, 1, ..} and compute...
-
What is multicollinearity? Why is it a problem in multiple regression?
-
A supermarket manager wants to know what type of people purchases health foods and wishes to determine why segments of the population resist buying these products. Discuss how you would go about...
-
What is a nonlinear regression model? Why do we sometimes choose to estimate a nonlinear model?
-
Some people argue that price indexes do not reflect the improvements in quality of the products we buy. Would this limitation cause estimates of inflation to be too high or too low?
-
What is a partial regression coefficient? How do we measure it?
-
The J = 2 to 3 rotational transition in a certain diatomic molecule occurs at 126.4 GHz, where 1 GHz 109 Hz. Find the frequency of the J = 5 to 6 absorption in this molecule.
-
Q1) What is the a3 Value Q2) What is the a7 Value Q3) What is the a4 Value Q4) What is the b3 Value Q5) What is the b2 Value Q6) What is the sign of 2nd constraint? A pastry chef at a bakery wants to...
-
If a person can select 3 presents from 10 presents under a Christmas tree, how many different combinations are there?
-
In how many ways can you choose 3 kinds of ice cream and 2 toppings from a dessert buffet with 10 kinds of ice cream and 6 kinds of toppings?
-
How many different tables of 4 can you make from 16 potential bridge players? How many different tables if 4 of the players insist on playing together?
-
The Clifford Corporation has announced a rights offer to raise $36 million. The stock currently sells for $28 per share and there are 18 million shares outstanding. If the subscription price is set...
-
Superman Enterprises has just completed an initial public offering. The firm sold 4,700,000 new shares at an offer price of $17.00 per share. The underwritering spread was $0.78 a share. The firm...
-
ABV is a non-dividend paying stock whose current price is $50. Its volatility is 12%. Over each of the next two 6-month periods the stock price is expected to go up by 9% or down by 8%. The risk-free...
Study smarter with the SolutionInn App