

A researcher wishes to predict the graduation rates in a sample of 240 colleges and universities based
Question:
A researcher wishes to predict the graduation rates in a sample of 240 colleges and universities based on the percentage of freshmen who were in the top tier (10%) of their high school class and the percentage of classes that have fewer than 20 students. The correlation matrix of graduation rate (GRADRATE), percentage of freshmen in the top tier of their high school graduating class (TOPFRESH), and the percentage of classes at the college with fewer than 20 students (SMALLCLS) is shown as follows:
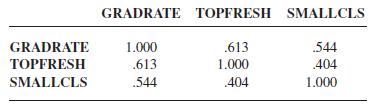
a. What percentage of the variance in GRADRATE does each of the predictor variables explain individually?
b. What percentage of the variance in GRADRATE do the two predictors explain in combination?
c. Why doesn’t the answer in (b) equal the sum of the two answers in (a)?
Step by Step Answer:
Solution a Top Freshmen 330000 b TOPFRESH ...View the full answer


Elementary Statistics In Social Research
ISBN: 9780205845484
12th Edition
Authors: Jack A. Levin, James Alan Fox, David R. Forde
