

Each year, Forbes and the Center for College Affordability and Productivity (CCAP) release a list of the
Question:
Each year, Forbes and the Center for College Affordability and Productivity (CCAP) release a list of the best colleges in the United States. Over 600 colleges and universities are ranked according to factors that fall into one of five categories.
1. Postgraduate success, which is based on salary of alumni by school and the alumni who appear on CCAP's America's Leaders list
2. Student debt, which is based on three components: average federal student loan debt load, student loan default rates, and predicted versus actual percent of students taking federal loans
3. Student satisfaction, which is based on student retention rates and student evaluations of professors
4. Graduation rate, which is based on how many students actually finish their degrees in four years and the actual versus predicted rate
5. Academic success, which is based on students who have won competitive scholarships and fellowships, and students who have gone on to earn Ph.D.s
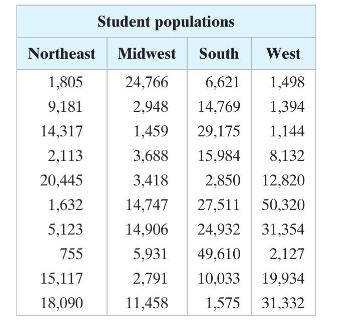
The table shows the student populations for randomly selected colleges by region on the 2016 list.
EXERCISES
1. Construct a side-by-side box-and-whisker plot for the four regions. Do any of the median student populations appear to be the same? Do any appear to be different?
In Exercises 2-5, use the sign test to test the claim. What can you conclude? Use \(\alpha=0.05\).
2. The median student population at a college in the Northeast is less than or equal to 7000 .
3. The median student population at a college in the Midwest is greater than or equal to 8000 .
4. The median student population at a college in the South is 10,000 .
5. The median student population at a college in the West is different from 8000 .
In Exercises 6 and 7, use the Wilcoxon rank sum test to test the claim. Use \(\alpha=0.01\).
6. There is no difference between student populations for colleges in the Midwest and colleges in the West.
7. There is a difference between student populations for colleges in the Northeast and colleges in the South.
Step by Step Answer:

This question has not been answered yet.
You can Ask your question!


Elementary Statistics Picturing The World
ISBN: 9781292260464
7th Global Edition
Authors: Betsy Farber, Ron Larson
