

Refer to the data set in Exercise 23 and the box-and-whisker plot you drew that represents the
Question:
Refer to the data set in Exercise 23 and the box-and-whisker plot you drew that represents the data set.
(a) About 25% of the students took no more than how many extra classes per week?
(b) What percent of the students took less than three extra classes per week?
(c) You randomly select one student from the sample. What is the likelihood that the student took more than 2 extra classes per week? Write your answer as a percent.
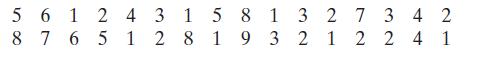
Data from Exercises 23
The numbers of extra classes taken per week by a sample of 32 students
Fantastic news! We've Found the answer you've been seeking!
Step by Step Answer:
a 2...View the full answer

Answered By
Utsab mitra
I have the expertise to deliver these subjects to college and higher-level students. The services would involve only solving assignments, homework help, and others.
I have experience in delivering these subjects for the last 6 years on a freelancing basis in different companies around the globe. I am CMA certified and CGMA UK. I have professional experience of 18 years in the industry involved in the manufacturing company and IT implementation experience of over 12 years.
I have delivered this help to students effortlessly, which is essential to give the students a good grade in their studies.
2+ Reviews
10+ Question Solved
Related Book For 

Elementary Statistics Picturing The World
ISBN: 9781292260464
7th Global Edition
Authors: Betsy Farber, Ron Larson
Question Posted:
