

The contingency table shows the results of a random sample of individuals by gender and type of
Question:
The contingency table shows the results of a random sample of individuals by gender and type of vehicle owned. At \(\alpha=0.01\), can you conclude that gender is related to the type of vehicle owned?
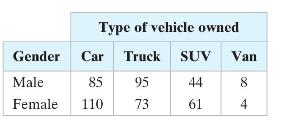
(a) find the expected frequency for each cell in the contingency table,
(b) identify the claim and state \(H_{0}\) and \(H_{a}\),
(c) determine the degrees of freedom, find the critical value, and identify the rejection region,
(d) find the chi-square test statistic,
(e) decide whether to reject or fail to reject the null hypothesis,
(f)) interpret the decision in the context of the original claim.
Fantastic news! We've Found the answer you've been seeking!
Step by Step Answer:

Answered By
PRINCE PANDEY
I am Indian Chartered Accounting having a strong hold in the subjects of Accounting, IFRS Reporting, Indian
Taxation, Cost Accounting, Auditing. I have vast experience of teaching a student with easy way problem-solving approach.
1+ Reviews
10+ Question Solved
Related Book For 

Elementary Statistics Picturing The World
ISBN: 9781292260464
7th Global Edition
Authors: Betsy Farber, Ron Larson
Question Posted:
