

The contingency table shows the distribution of a random sample of fatal pedestrian motor vehicle collisions by
Question:
The contingency table shows the distribution of a random sample of fatal pedestrian motor vehicle collisions by time of day and gender in a recent year. At α = 0.10, can you conclude that time of day and gender are related?
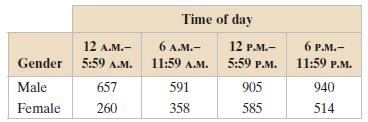
(a) Find the expected frequency for each cell in the contingency table,
(b) Identify the claim and state H0 and Ha,
(c) Determine the degrees of freedom, find the critical value, and identify the rejection region,
(d) Find the chi-square test statistic,
(e) Decide whether to reject or fail to reject the null hypothesis,
(f) Interpret the decision in the context of the original claim. If convenient, use technology.
DistributionThe word "distribution" has several meanings in the financial world, most of them pertaining to the payment of assets from a fund, account, or individual security to an investor or beneficiary. Retirement account distributions are among the most...
Fantastic news! We've Found the answer you've been seeking!
Step by Step Answer:
a Expected frequencies b The claim is time of day and gend...View the full answer

Answered By
Ann Wangechi
hey, there, paying attention to detail is one of my strong points, i do my very best combined with passion. i enjoy researching since the net is one of my favorite places to be and to learn. i am a proficient and versatile blog, article academic and research writing i possess excellent English writing skills, great proof-reading. i am a good communicator and always provide feedback in real time. i'm experienced in the writing field, competent in computing, essays, accounting and research work and also as a Database and Systems Administrator
151+ Reviews
291+ Question Solved
Related Book For 

Elementary Statistics Picturing The World
ISBN: 9780321911216
6th Edition
Authors: Ron Larson, Betsy Farber
Question Posted:
