

The distribution of Scholastic Assessment Test (SAT) scores for 38 high school seniors who graduated in the
Question:
The distribution of Scholastic Assessment Test (SAT) scores for 38 high school seniors who graduated in the top third of their class is as follows:
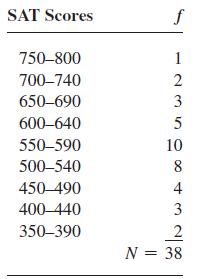
a. For each class interval, find the size, midpoint, upper and lower limits, the cumulative frequency, the percentage, and the cumulative percentage.
b. To depict the distribution of SAT scores for the 38 students, draw a histogram and a frequency polygon.
c. To depict the cumulative distribution of these SAT scores, draw a cumulative frequency polygon.
Fantastic news! We've Found the answer you've been seeking!
Step by Step Answer:
a Here is the table showing the information for each class in...View the full answer

Answered By
Ernie Moises Evora
I have worked as a teacher, a tutor and instructor.
I have also worked as a community leader in my community.
0 Reviews
10+ Question Solved
Related Book For 
Elementary Statistics In Social Research
ISBN: 9780205845484
12th Edition
Authors: Jack A. Levin, James Alan Fox, David R. Forde
Question Posted:
