

The table below shows the winning times (in seconds) for the men's and women's 100-meter runs in
Question:
The table below shows the winning times (in seconds) for the men's and women's 100-meter runs in the Summer Olympics from 1928 to 2016.
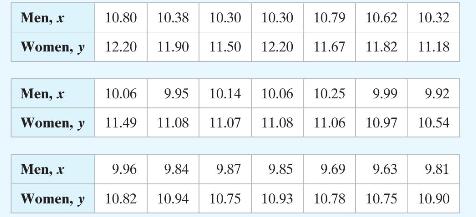
(a) Display the data in a scatter plot, calculate the correlation coefficient \(r\), and describe the type of correlation.
(b) At \(\alpha=0.05\), is there enough evidence to conclude that there is a significant linear correlation between the winning times for the men's and women's 100 -meter runs?
(c) Find the equation of the regression line for the data. Draw the regression line on the scatter plot.
(d) Use the regression equation to predict the women's 100-meter time when the men's 100 -meter time is 9.90 seconds.
Fantastic news! We've Found the answer you've been seeking!
Step by Step Answer:

Answered By
Pushpinder Singh
Currently, I am PhD scholar with Indian Statistical problem, working in applied statistics and real life data problems. I have done several projects in Statistics especially Time Series data analysis, Regression Techniques.
I am Master in Statistics from Indian Institute of Technology, Kanpur.
I have been teaching students for various University entrance exams and passing grades in Graduation and Post-Graduation.I have expertise in solving problems in Statistics for more than 2 years now.I am a subject expert in Statistics with Assignmentpedia.com.
3+ Reviews
10+ Question Solved
Related Book For 

Elementary Statistics Picturing The World
ISBN: 9781292260464
7th Global Edition
Authors: Betsy Farber, Ron Larson
Question Posted:
