

The table at the right shows the residential natural gas expenditures (in dollars) in one year for
Question:
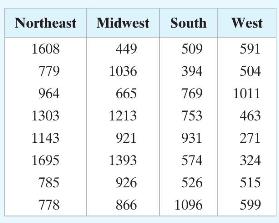
The table at the right shows the residential natural gas expenditures (in dollars) in one year for a random sample of households in four regions of the United States. Assume that the populations are normally distributed and the population variances are equal. At \(\alpha=0.10\), can you reject the claim that the mean expenditures are the same for all four regions?
Fantastic news! We've Found the answer you've been seeking!
Step by Step Answer:
There is enough evidence at ...View the full answer

Answered By
PU Student
cost accounting
financial accounting
auditing
internal control
business analyst
tax
i have 3 years experience in field of management & auditing in different multinational firms. i also have 16 months experience as an accountant in different international firms. secondary school certification.
higher secondary school certification.
bachelors in mathematics.
cost & management accountant
4+ Reviews
10+ Question Solved
Related Book For 

Elementary Statistics Picturing The World
ISBN: 9781292260464
7th Global Edition
Authors: Betsy Farber, Ron Larson
Question Posted:
