

The table shows the amounts of caffeine (in milligrams) in 16-ounce servings for a random sample of
Question:
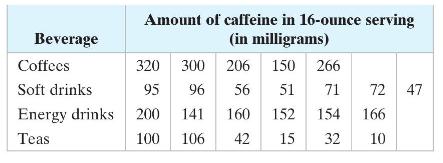
The table shows the amounts of caffeine (in milligrams) in 16-ounce servings for a random sample of beverages. At \(\alpha=0.01\), can you conclude that the distribution of the amounts of caffeine in at least one beverage is different from the others?
(a) identify the claim and state \(H_{0}\) and \(H_{a}\),
(b) find the critical value and identify the rejection region,
(c) find the test statistic \(H,\)
(d) decide whether to reject or fail to reject the null hypothesis,
(e) interpret the decision in the context of the original claim.
Fantastic news! We've Found the answer you've been seeking!
Step by Step Answer:

Answered By
Simon kingori
I am a tier-one market researcher and content developer who has been in this field for the last six years. I’ve run the freelancing gamut; from market research, data mining and SEO/SMM to copywriting, Content Development, you name it, I’ve done it. I’m extremely motivated, organized and disciplined – you have to be to work from home. My experience in Freelancing is invaluable- but what makes me a cut above the rest is my passion to deliver quality results to all my clients- it’s important to note, I've never had a dissatisfied client. Backed by a Masters degree in Computer Science from MOI university, I have the required skill set and burning passion and desire to deliver the best results for my clients. This is the reason why I am a cut above the rest. Having taken a Bsc. in computer science and statistics, I deal with all round fields in the IT category. It is a field i enjoy working in as it is dynamic and new things present themselves every day for research and exploration.
1+ Reviews
10+ Question Solved
Related Book For 

Elementary Statistics Picturing The World
ISBN: 9781292260464
7th Global Edition
Authors: Betsy Farber, Ron Larson
Question Posted:
