

The table shows the annual salaries for a random sample of private industry workers in Kentucky, North
Question:
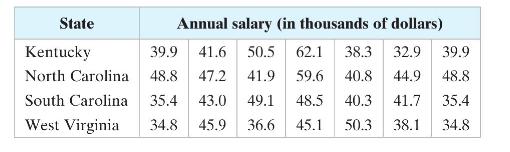
The table shows the annual salaries for a random sample of private industry workers in Kentucky, North Carolina, South Carolina, and West Virginia. At \(\alpha=0.10\), can you conclude that the distribution of the annual salaries of private industry workers in at least one state is different from the others?
(a) identify the claim and state \(H_{0}\) and \(H_{a}\),
(b) find the critical value and identify the rejection region,
(c) find the test statistic \(H,\)
(d) decide whether to reject or fail to reject the null hypothesis,
(e) interpret the decision in the context of the original claim.
Fantastic news! We've Found the answer you've been seeking!
Step by Step Answer:

Answered By
Joemar Canciller
I teach mathematics to students because I love to share what I have in this field.
I also want to see the students to love math and be fearless in this field.
I've been tutoring these past 2 years and I would like to continue what I've been doing.
1+ Reviews
10+ Question Solved
Related Book For 

Elementary Statistics Picturing The World
ISBN: 9781292260464
7th Global Edition
Authors: Betsy Farber, Ron Larson
Question Posted:
