

The table shows the energy consumed (in millions of Btu) in one year for a random sample
Question:
The table shows the energy consumed (in millions of Btu) in one year for a random sample of households from four U.S. regions. At \(\alpha=0.01\), can you conclude that the energy consumed is different in at least one region?
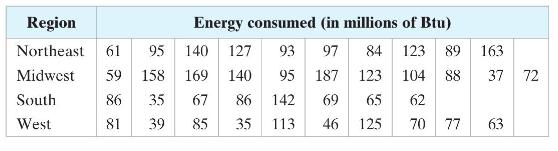
(a) perform a Kruskal-Wallis test.
(b) perform a one-way ANOVA test, assuming that each population is normally distributed and the population variances are equal.
(c) Compare the results.
Fantastic news! We've Found the answer you've been seeking!
Step by Step Answer:

Answered By
Deepak Pal
Hi there! Are you looking for a committed, reliable, and enthusiastic tutor? Well, teaching and learning are more of a second nature to me, having been raised by parents who are both teachers. I have done plenty of studying and lots of learning on many exciting and challenging topics. All these experiences have influenced my decision to take on the teaching role in various capacities. As a tutor, I am looking forward to getting to understand your needs and helping you achieve your academic goals. I'm highly flexible and contactable. I am available to work on short notice since I only prefer to work with very small and select groups of students. Areas of interest: Business, accounting, Project management, sociology, technology, computers, English, linguistics, media, philosophy, political science, statistics, data science, Excel, psychology, art, history, health education, gender studies, cultural studies, ethics, religion. I am also decent with math(s) & Programming. If you have a project you think I can take on, please feel welcome to invite me, and I'm going to check it out!
1+ Reviews
10+ Question Solved
Related Book For 

Elementary Statistics Picturing The World
ISBN: 9781292260464
7th Global Edition
Authors: Betsy Farber, Ron Larson
Question Posted:
