

The table shows the prices (in dollars per bushel) received for barley and corn for a random
Question:
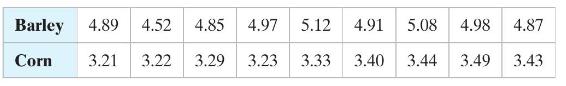
The table shows the prices (in dollars per bushel) received for barley and corn for a random sample of nine U.S. farmers. At \(\alpha=0.05\), can you conclude that there is a significant correlation between the barley and corn prices?
(a) identify the claim and state \(H_{0}\) and \(H_{a}\),
(b) find the critical value,
(c) find the test statistic \(r_{s}\),
(d) decide whether to reject or fail to reject the null hypothesis, and
(e) interpret the decision in the context of the original claim.
Fantastic news! We've Found the answer you've been seeking!
Step by Step Answer:
a b 0700 c 0500 d Fail to reject H 0 ...View the full answer

Answered By
Ashok Kumar Malhotra
Chartered Accountant - Accounting and Management Accounting for 15 years.
QuickBooks Online - Certified ProAdvisor (Advance - QuickBooks Online for 3 years.
3+ Reviews
10+ Question Solved
Related Book For 

Elementary Statistics Picturing The World
ISBN: 9781292260464
7th Global Edition
Authors: Betsy Farber, Ron Larson
Question Posted:
