

The accompanying graph depicts average full-time incomes of women and men aged 18 and over. For a
Question:
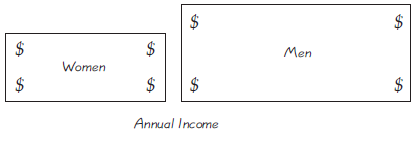
The accompanying graph depicts average full-time incomes of women and men aged 18 and over. For a recent year, those incomes were $37,197 for women and $53,059 for men (based on data from the U.S. Census Bureau). Does the graph make a fair comparison of the data? Why or why not? If the graph distorts the data, construct a fair graph.
Fantastic news! We've Found the answer you've been seeking!
Step by Step Answer:
The graphs are given below It is given the average full time incomes o...View the full answer

Answered By
Charles Okinda
students should give all the instructions concerning the challenge that they face. they will get an immediate response because I am always online.
752+ Reviews
1477+ Question Solved
Related Book For 

Question Posted:
