

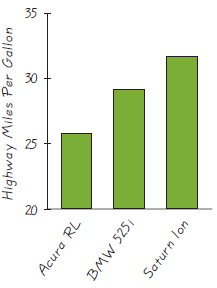
The accompanying graph depicts the fuel consumption (in miles per gallon) for highway conditions of three cars.
Question:
The accompanying graph depicts the fuel consumption (in miles per gallon) for highway conditions of three cars. Does the graph depict the data fairly, or does it somehow distort the data? Explain.
Fantastic news! We've Found the answer you've been seeking!
Step by Step Answer:
A ttest is an inferential statistic used to determine if the...View the full answer

Answered By
Dudhat Vaidehi
I tutored mostly elementary school students privately after school and during the summer. We met in their homes or at the public library. I charged an hourly fee, and I provided any necessary materials.
Having taught in special education in two local schools for many years meant that I had contact with a lot of parents of special needs students. I never had to advertise — word of mouth was how most folks knew of me. At one point I did have a website, but didn't utilize it much. I stayed very busy, especially in the summers, and always had a full schedule. I typically met with each student's teacher in order to get an idea of what the focus of my instruction/remediation should be. Becoming familiar with the student's learning style(s) was also very helpful. Often parents would share records and test results with me. After each tutoring session, I documented the student’s progress and gave parents written updates, as well as phone calls or emails as needed.
While my students and I certainly utilized technology and the internet often during our sessions, I never tutored online or for any tutoring company, so am not familiar with the curriculums or methods used in those settings.
Tutoring one on one was very enjoyable and rewarding. My students and I had fun, and grew quite fond of one another. The extra income was a bonus. I had to retire from tutoring due to a physically handicapping disease, and miss my students very much.
0 Reviews
10+ Question Solved
Related Book For 

Question Posted:
