

The following frequency distribution categorizes U.S. adults aged 18 and over by educational attainment in a recent
Question:
The following frequency distribution categorizes U.S. adults aged 18 and over by educational attainment in a recent year.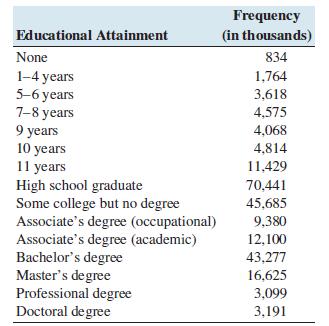
a. Construct a frequency bar graph.
b. Construct a relative frequency distribution.
c. Construct a relative frequency bar graph.
d. Construct a frequency distribution with the following categories: 8 years or less, 9–11 years, High school graduate, Some college but no degree, College degree (Associate’s or Bachelor’s), Graduate degree (Master’s, Professional, or Doctoral).
e. Construct a pie chart for the frequency distribution in part (d).
f. What proportion of people did not graduate from high school?
Step by Step Answer:

This question has not been answered yet.
You can Ask your question!
Related Book For 

Question Posted:
