

The following frequency distribution presents the batting averages of Major League Baseball players who had 300 or
Question:
The following frequency distribution presents the batting averages of Major League Baseball players who had 300 or more plate appearances during a recent season.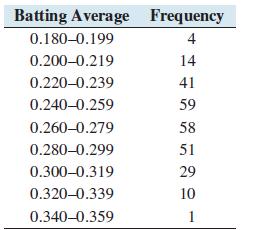
a. How many classes are there?
b. What is the class width?
c. What are the class limits?
d. Construct a frequency histogram.
e. Construct a relative frequency distribution.
f. Construct a relative frequency histogram.
g. What percentage of players had batting averages of 0.300 or more?
h. What percentage of players had batting averages less than 0.220?
Fantastic news! We've Found the answer you've been seeking!
Step by Step Answer:

Answered By
Ashish Jaiswal
I have completed B.Sc in mathematics and Master in Computer Science.
20+ Reviews
39+ Question Solved
Related Book For 

Question Posted:
