

The following table presents monthly interest rates, in percent, for 30-year and 15-year fixed-rate mortgages, for a
Question:
The following table presents monthly interest rates, in percent, for 30-year and 15-year fixed-rate mortgages, for a recent year.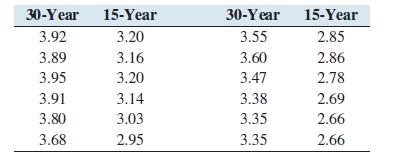
a. Construct a scatterplot of the 15-year rate (y) versus the 30-year rate (x).
b. Compute the correlation coefficient between 30-year and 15-year rates.
c. When the 30-year rate is below average, would you expect the 15-year rate to be above or below average?
Explain.
d. Which of the following is the best interpretation of the correlation coefficient?
i. When a bank increases the 30-year rate, that causes the 15-year rate to rise as well.
ii. Interest rates are determined by economic conditions.
When economic conditions cause 30-year rates to increase, these same conditions cause 15-year rates to increase as well.
iii. When a bank increases the 15-year rate, that causes the 30-year rate to rise as well.
Step by Step Answer:


