

The following table presents the average ticket price (the average price paid per attendee) in dollars and
Question:
The following table presents the average ticket price (the average price paid per attendee) in dollars and the gross revenue (in millions of dollars) for Broadway productions for each of 20 seasons.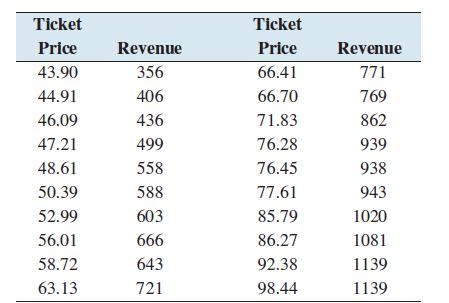
a. Compute the least-squares regression line for predicting gross revenue (y) from ticket price (x).
b. Compute the coefficient of determination.
c. Construct a residual plot. Does the relationship appear to be linear?
d. True or false: If the coefficient of determination is large, the relationship must be linear.
Step by Step Answer:

This question has not been answered yet.
You can Ask your question!
Related Book For 

Question Posted:
