

The following table presents the number of cars sold by several manufacturers in a recent month. a.
Question:
The following table presents the number of cars sold by several manufacturers in a recent month.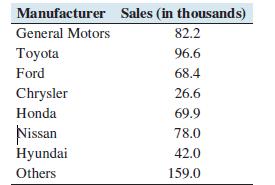
a. Construct a frequency bar graph.
b. Construct a relative frequency distribution.
c. Construct a relative frequency bar graph.
d. Construct a pie chart.
e. What proportion of sales were for General Motors cars?
Step by Step Answer:

This question has not been answered yet.
You can Ask your question!
Related Book For 

Question Posted:
