

The following table presents the number of light trucks sold by several manufacturers in a recent month.
Question:
The following table presents the number of light trucks sold by several manufacturers in a recent month.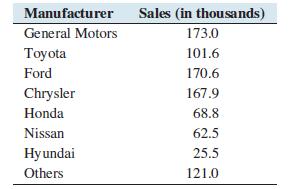
a. Construct a frequency bar graph.
b. Construct a relative frequency distribution.
c. Construct a relative frequency bar graph.
d. Construct a pie chart.
e. True or false: More light trucks were sold by Chrysler than by Honda, Nissan, and Hyundai combined.
Step by Step Answer:

This question has not been answered yet.
You can Ask your question!
Related Book For 

Question Posted:
