

The following table presents the percentage of U.S. residential rental units that were vacant during each quarter
Question:
The following table presents the percentage of U.S. residential rental units that were vacant during each quarter from 2012 through 2015.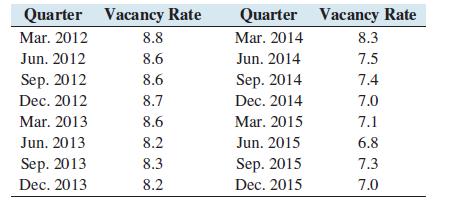
a. Construct a time-series plot for these data.
b. From 2012 through 2015, the proportion of Americans who owned a home declined. What was the trend in the vacancy rate during this time period?
Step by Step Answer:

This question has not been answered yet.
You can Ask your question!
Related Book For 

Question Posted:
