

The following table presents the U.S. unemployment rate for each of the years 1993 through 2016. a.
Question:
The following table presents the U.S. unemployment rate for each of the years 1993 through 2016.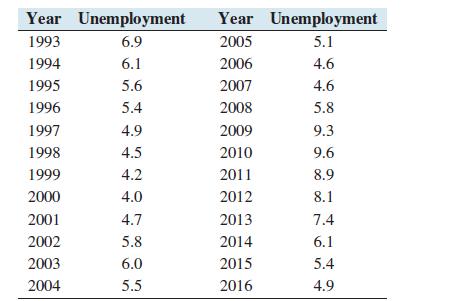
a. Construct a time-series plot of the unemployment rate.
b. For which periods of time was the unemployment rate increasing? For which periods was it decreasing?
Step by Step Answer:

This question has not been answered yet.
You can Ask your question!
Related Book For 

Question Posted:
