

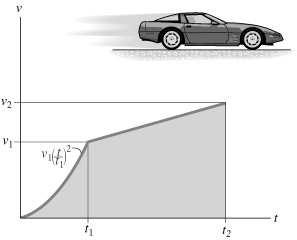
The v-t graph for the motion of a car as it moves along a straight road is
Question:
The v-t graph for the motion of a car as it moves along a straight road is shown. Draw the s-t graph and determine the average speed and the distance traveled for the time interval 0 2. The car starts from rest at s = 0. Given:
Fantastic news! We've Found the answer you've been seeking!
Step by Step Answer:
The graph T1 0001t1t1 T2 t1 101t1 t2 S1 71 272 23 ft t1 v...View the full answer

Answered By
Robert Mbae
I have been a professional custom essay writer for the last three years. Over that period of time, I have come to learn the value of focusing on the needs of the clients above everything else. With this knowledge, I have worked hard to become an acclaimed writer that can be trusted by the customers to handle the most important custom essays. I have the necessary educational background to handle projects up to the Ph.D. level. Among the types of projects that I've done, I can handle everything within Dissertations, Project Proposals, Research Papers, Term Papers, Essays, Annotated Bibliographies, and Literature Reviews, among others.
Concerning academic integrity, I assure you that you will receive my full and undivided attention through to the completion of every essay writing task. Additionally, I am able and willing to produce 100% custom writings with a guarantee of 0% plagiarism. With my substantial experience, I am conversant with all citation styles ranging from APA, MLA, Harvard, Chicago-Turabian, and their corresponding formatting. With all this in mind, I take it as my obligation to read and understand your instructions, which reflect on the quality of work that I deliver. In my paper writing services, I give value to every single essay order. Besides, whenever I agree to do your order, it means that I have read and reread your instructions and ensured that I have understood and interpreted them accordingly.
Communication is an essential part of a healthy working relationship. Therefore, I ensure that I provide the client with drafts way long before the deadline so that the customer can review the paper and comment. Upon completion of the paper writing service, the client has the time and right to review it and request any adjustments before releasing the payment.
1+ Reviews
10+ Question Solved
Related Book For 
Question Posted:
